
Feature image taken by Anna Chandler.
The DP1 Biology field trip that took place a day after school started was an essential part of the IB diploma program Biology curriculum. On this trip we take part in numerous field tests which include: quadrats in various areas, soil sampling in each of the quadrats, lichen studies, river studies. The study that we focused most of our time on were the quadrats studies of which we did 6, two in each area which include primary forest, secondary, and a plantation with heavy human influence on the environment. For this study, our main objective was to find the level of biodiversity in each of these areas. Presumably, areas that had more human contact would have less biodiversity due to how people can effect the environment in a way that would disrupt the balance that allows for so many species to coexist. Much of the actual calculations and work occurred after we had gathered the raw data. We used the Simpson’s Biodiversity Index in particular to calculate the level of biodiversity at each of the quadrats. The quadrats themselves were each ten by ten meters long in the midst of the forest or plantation. These tended to be very time consuming which meant that we could only afford to do two each day for each of the three areas.

Image taken by Anna Chandler.
The second major study we did was the river study where we gathered data about a variety of aspects of the river. The two major components of this was the ripple and pool sections of the river. The ripple is where the water is flowing quickly where the water meets rocks while the pool is where there are no rocks in the middle of the stream to disrupt the flow and quicken it, where the water flows slowly. For both these sections of the river, we would measure the depth of the riverbed at 30 centimeter intervals perpendicular to the flow of water. We also measured a length of 15 meters of the river which included a ripple and a pool section to determine the subsection of the river we would study. Once this was done, we were able to sketch the shape of the river and create a diagram to represent this. Another major aspect of the river study was measuring the speed of the water flow at both the ripple and pool sections. 5 trials for this test was conducted and the average of the raw data was calculated and taken as the average speed of the pool or ripple respectively. Finally, we also took note of the average temperature at the both the pool and ripple river sections. Though these tests may seem to be incoherent and not supporting a singular aim, we collect this data so that we can come up with correlations that we discover.
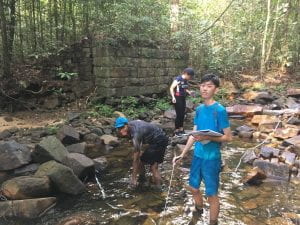
Image taken by Anna Chandler.
Essentially, the creativity aspect of this trip comes from our ability to use the data and testing that we do to come up with feasible experiment and lab ideas that we can carry out. Some ideas for viable research questions can be based on how the location of the quadrats effect the level of biodiversity or how the depth of water in rivers affects the water temperature. However, although there is a heavy emphasis on the work aspect of this trip, there were still plenty of eventful activities that occurred throughout. The long hikes that we took to get to the areas for the studies were physically strenuous and exhausting but fulfilling all the same. We were even able to bond closer with fun activities we made for ourselves such as water sliding down the natural rock formations of the river. All in all, this was a well rounded trip in many ways acting as a work activity and a fun retreat at the same time with lots of physical activity as per all the hiking required.

Image taken by Anna Chandler.