
Service is still at home, but everyone is now working on different Capstone Projects. My Capstone Project is about tracking electricity at home using the CEB website, and how you can easily do it. Furthermore, I will go into detail about my own electricity usage at home.
The Ceylon Electricity Board (CEB) Website
You can visit the CEB website here: www.ceb.lk. To use the websites features with relation to your own power, you will need to register an account, and obtain the following pieces of information:

Information to register for a CEB account.
The CEB account number will be given to everyone, and you will have to call the CEB to get it if you do not know it. All the other information is your own. Once you register, you are able to view your past electricity bills, plus pay any outstanding bills, all online.
Another very useful feature of this website is tracking power outages, both scheduled and unplanned.

With your account number, you can view a calendar of power outages that will, and have, affected you.
You can also view a map of power outages around the country. This gives a lot of useful information about when power will be restored, the cause of the outage and how many people are affected.
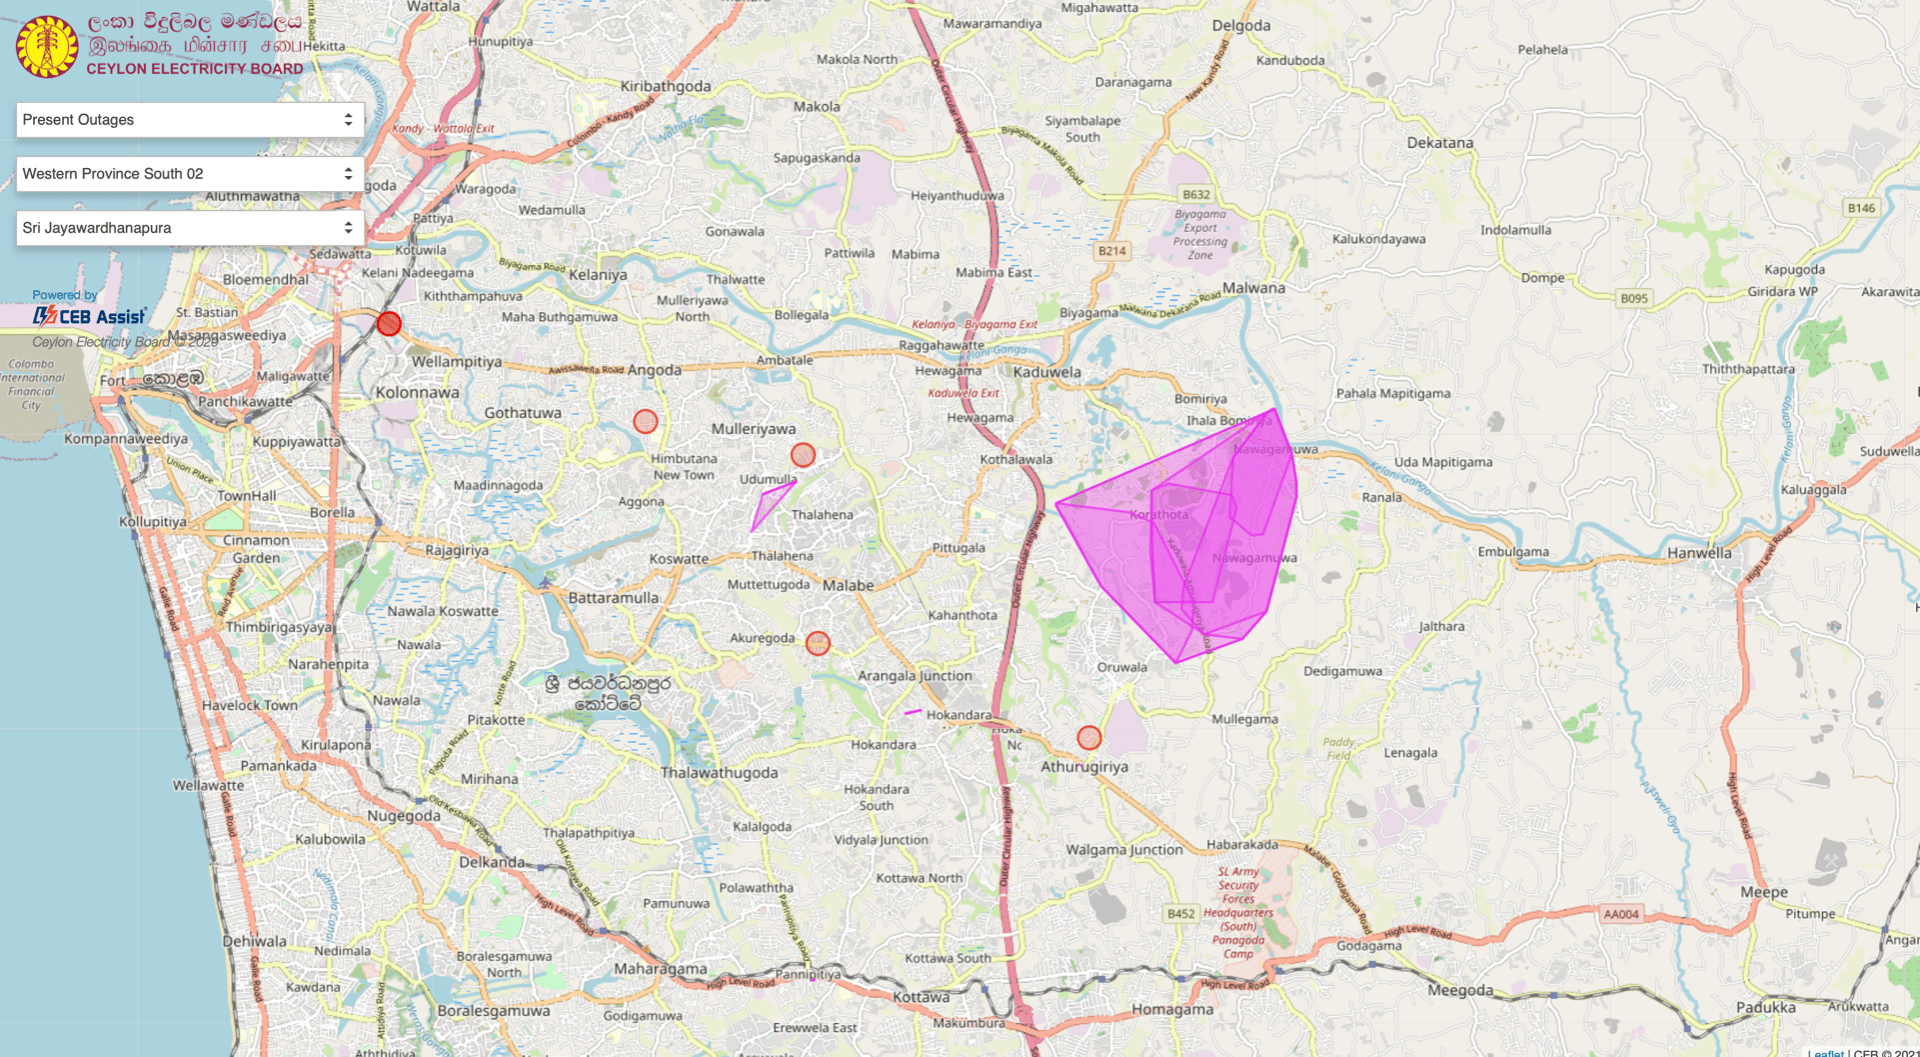
Map of outages
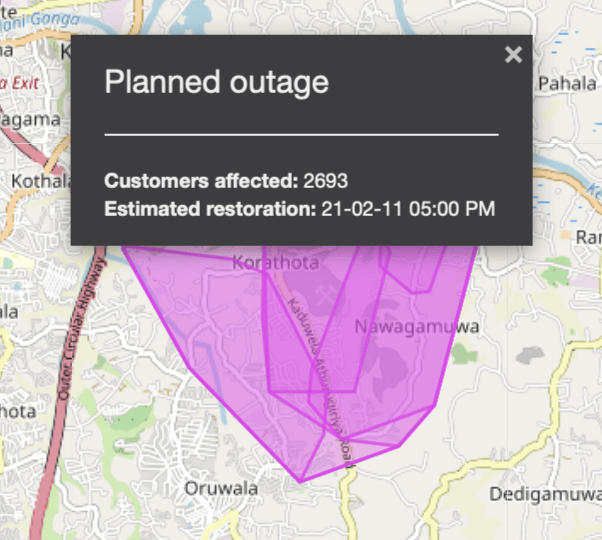
Information about planned outage
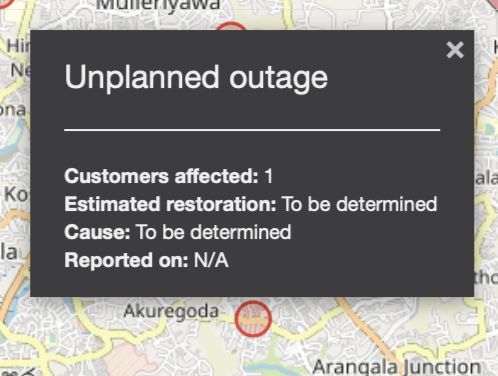
Information about unplanned outage
The website also gives some more general information about electricity usage in Sri Lanka. This information is interesting to know about, and an example of such information would be the most used ways energy is generated in Sri Lanka.

Methods of energy generation in Sri Lanka
The chart above shows that the majority is fossil fuels, but hydro power also generates a high percentage of electricity. The table also shows a breakdown of each generation method, such as the different fossil fuels, or the different hydro power stations.
One final useful feature from the CEB is getting an SMS message for information on power outages and your electricity bill. The image below shows the instructions on how to register.

Registering for CEB SMS messages.
These are the many features of the CEB website. The information on power outages is very useful, as you can plan your day out by knowing about power outages. The general information about electricity is interesting to know, plus the SMS feature is very useful for getting notified about important information.
My Own Electricity
My house has been fitted with solar panels, with a capacity of 10.2 kWp. kWp (Kilowatts peak) is the rate at which solar panels generates energy at peak performance (Solarae). In Sri Lanka, the way solar panels work is not as you may think. The power from the solar panels do not directly power the house, but rather is sent to the CEB electricity system. Since the panels are essentially generating power for the CEB, we get paid by the CEB for the amount that we generate, so it is possible to get a negative electricity bill.
For this Capstone Project I wanted to look at the statistics and data our solar power generation, so after some time trying to find the login information to the system, I got in. I then discovered that the system hasn’t been tracking any information since the end of 2019. Therefore, there is only have data from 2019, plus a few days of 2021 when the system was fixed and began collecting data again.
The first chart below shows all the electricity generated in 2019.
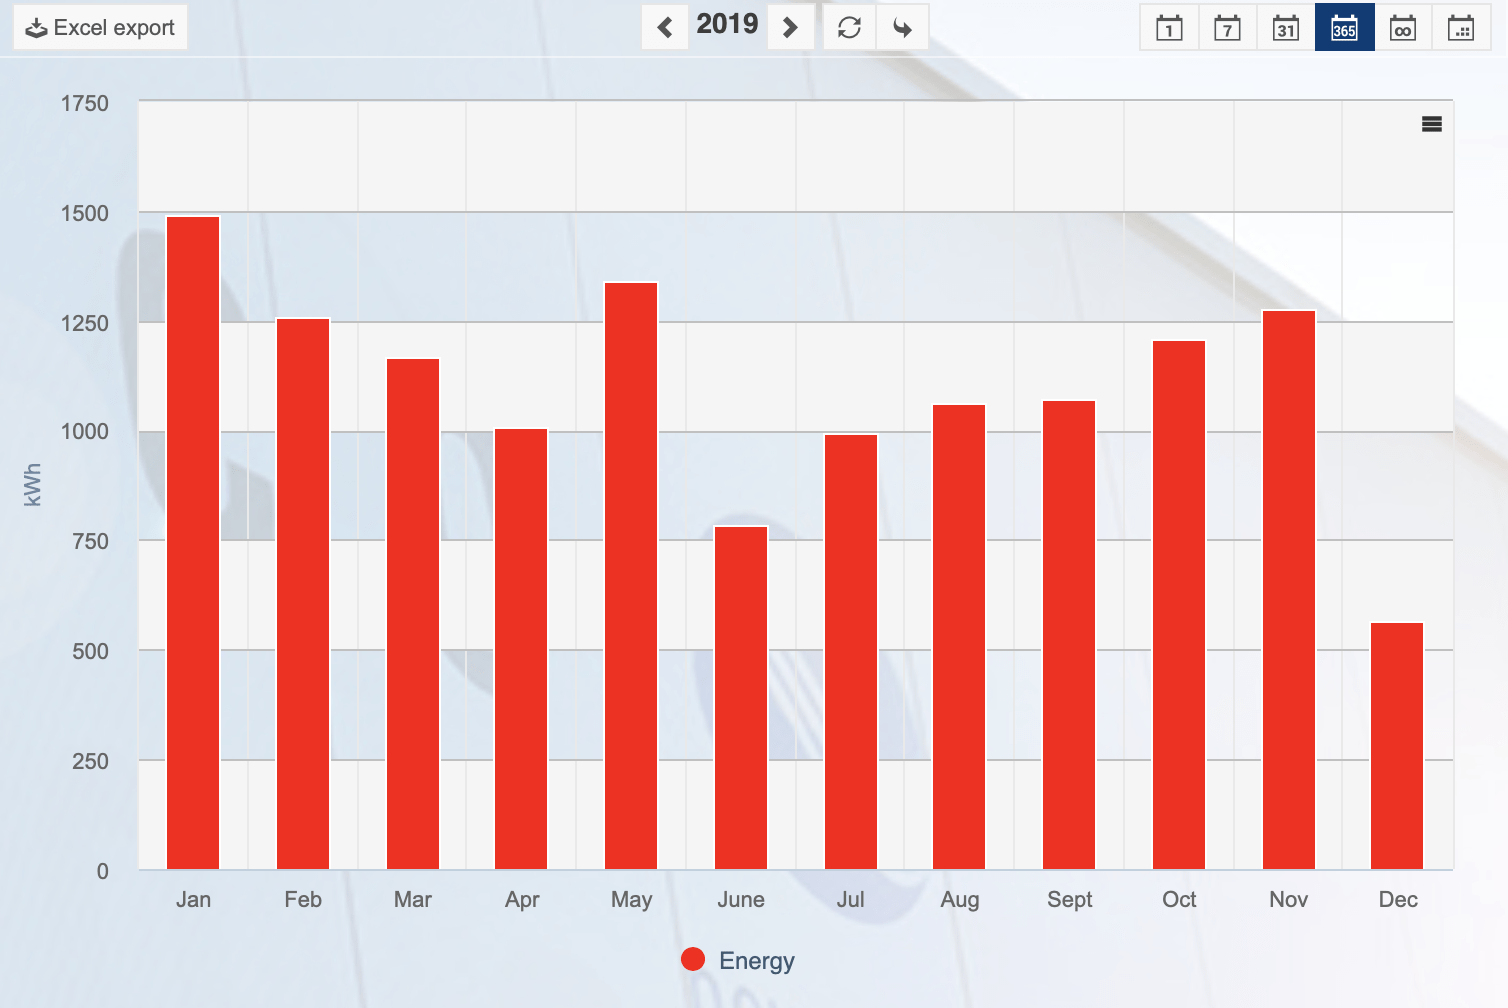
Electricity generated in 2019.
The most electricity was generated in January, May and November. This can be due to multiple factors, such as it was very sunny during those months or there were less power cuts (the solar generator needs power from CEB to generate electricity, so a power cut means the solar panels won’t work). December is very low, and this is because the system stopped getting data in this month.
The next chart shows electricity generated over one day.
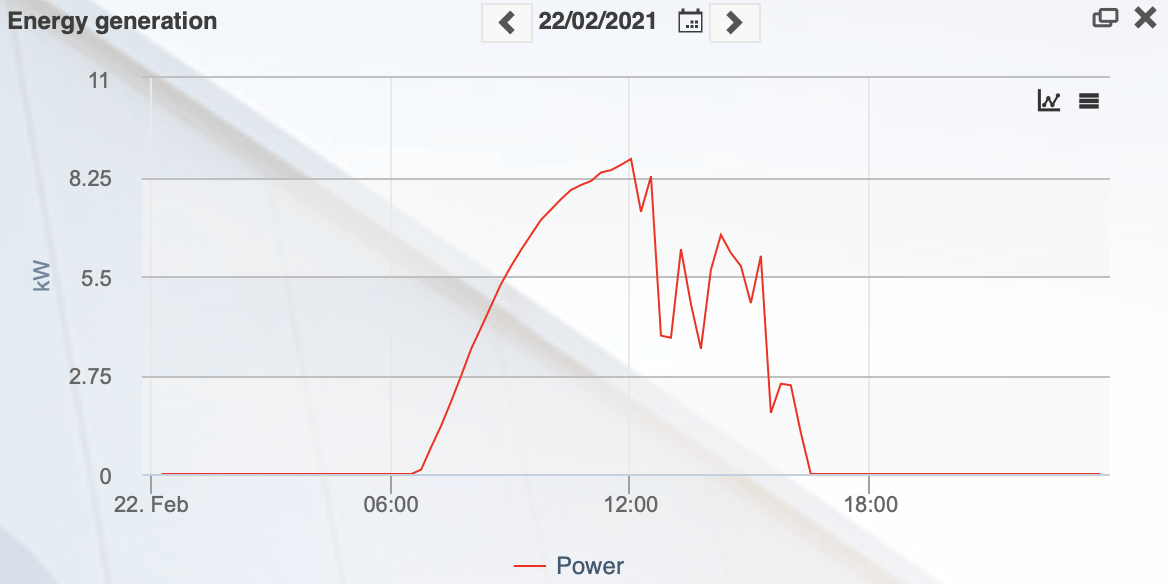
Electricity generated over a day.
The generation peaks midday, because that is when the sun is strongest. There is a steady increase from sunrise to midday in terms of energy, but from midday to sunset, there are many deviations. This can be due to it being cloudy or raining during this time.
This final image shows the environmental impact we have had by going to solar.
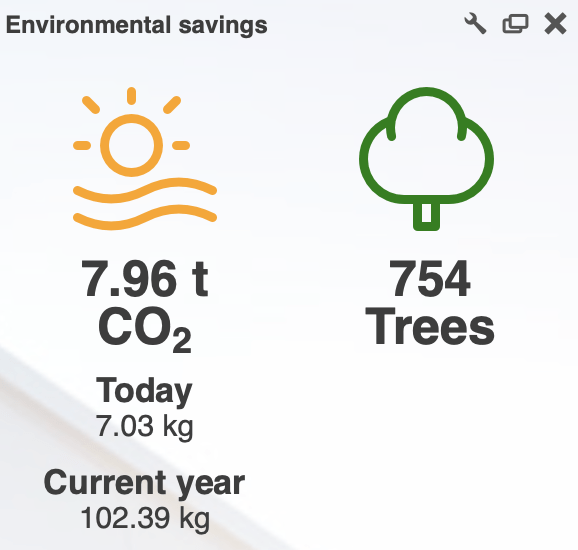
Environmental savings
Unfortunately, this is inaccurate, as it is only for 2019 and a few extra days. However, it is still interesting to know that over 750 trees and 8 tons of CO2 have been saved by us switching to solar. That is a huge positive impact, and it feels good to know that. For comparison, the average gas car generates 4.6 tons of CO2 in a year (EPA), so in just a year we have saved nearly half of how much an average gas car emits.
Learning Outcomes
In terms of learning outcomes, I have engaged with issues of global significance. All of this information about electricity and the climate are huge issues around the world, and the small impact I have in mitigating that is important, and it is also important to share it, so those who read this are also inspired to do their part.
Leave a Reply